
Impact Analysis utilises Visitation Data to assess the influence a potential site will have on your network. By examining the routes of devices that have visited an established location and comparing them to potential routes leading to the new site under consideration, you can determine which route is more convenient for the visitors.
Before you Begin
✅ Make sure you have access to valid Visitation Data credits (check our Visitation Data guide for more information)
✅ Contact GapMaps to enable Impact Analysis and ensure the credits are added to your account
✅ Ensure Visitation Data reports have been generated for existing sites that could potentially be impacted
✅ Ensure the pins you are running Impact Assessments on are in the right location
✅ Read through our article on Impact Analysis - Key Features
Running an Impact Analysis
- Select the existing location you wish to assess for potential impacts
- If you haven't done so already, run a Visitation Data report on the pin
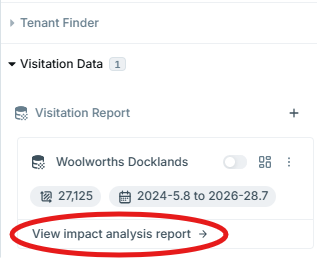
- Expand the Visitation Data section and select 'View Impact analysis report'
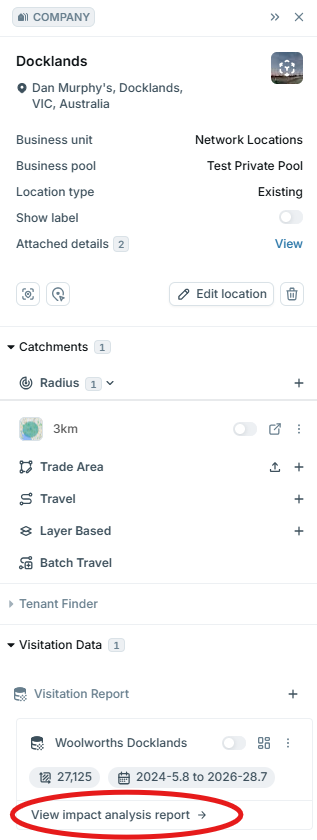
- Adjust the access point for your existing location to the most practical curbside entry point to the property by clicking 'access point'
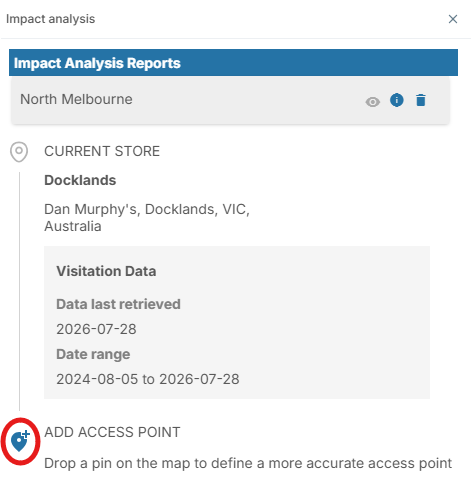
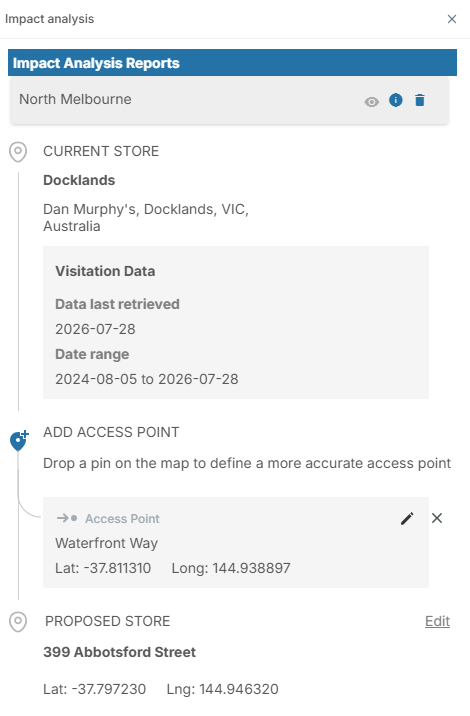
- Enter the address of the potential site and a name for the report
- Adjust the location pin for the potential site to the most practical curbside entry point to the property by clicking and dragging the pin
- OPTIONAL: Add a Travel Mode (drive time or walk time)
- Select 'Run assessment'. The report can take up to 15 minutes to generate
Viewing Impact Analysis Reports
- Once you have received a notification that this report has generated, choose the pin where the report was generated, then expand the visitation data section and click on the 'View Impact analysis report' button.
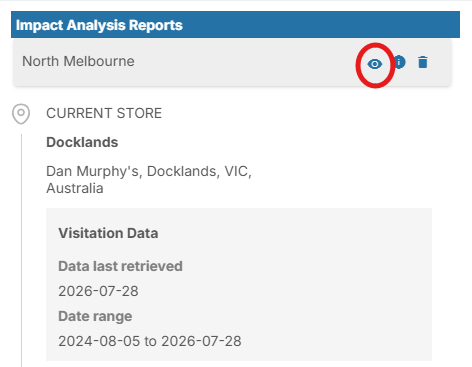
- Click 'Show' on the report
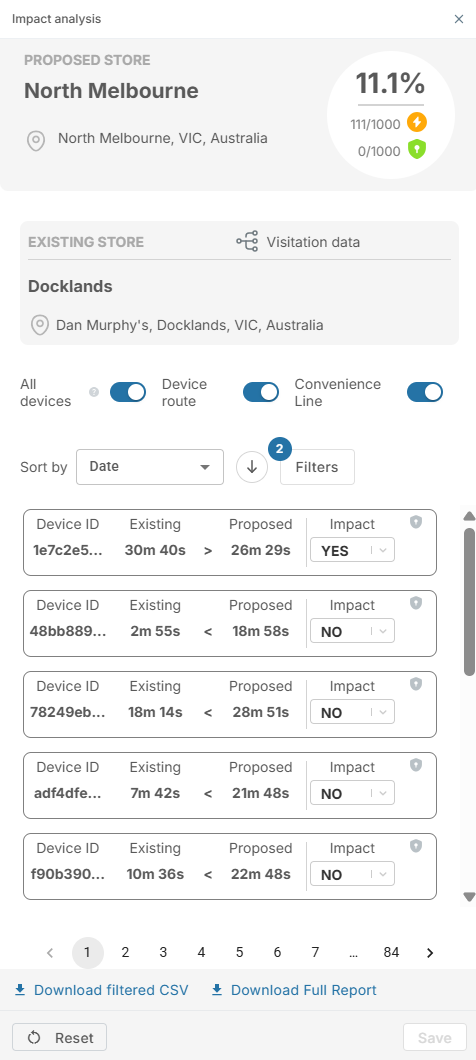
|
1 |
Impact Analysis Summary |
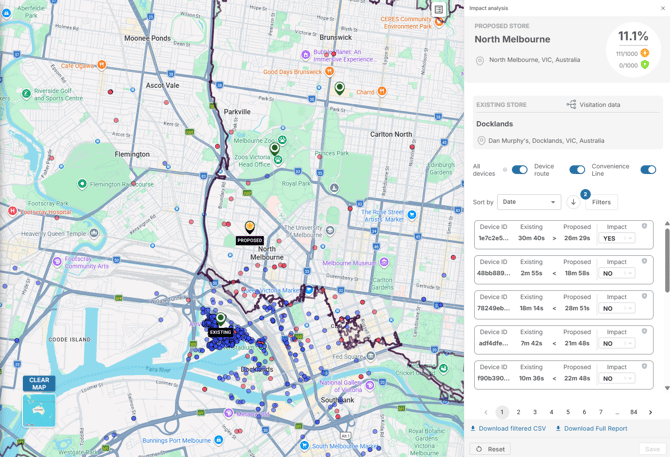
Displays information on:
Percentage of Impacted Visits The percentage of visits identified as impacted in relation to the total number of visits analyzed.
Impacted Routes The number of impacted routes compared to the total routes analyzed.
Verified Routes The number of verified routes. (Note: For a route to be verified, you must analyse and select the verified button) |
|
2 |
Visualisation Tools |
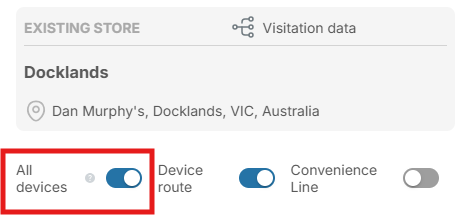
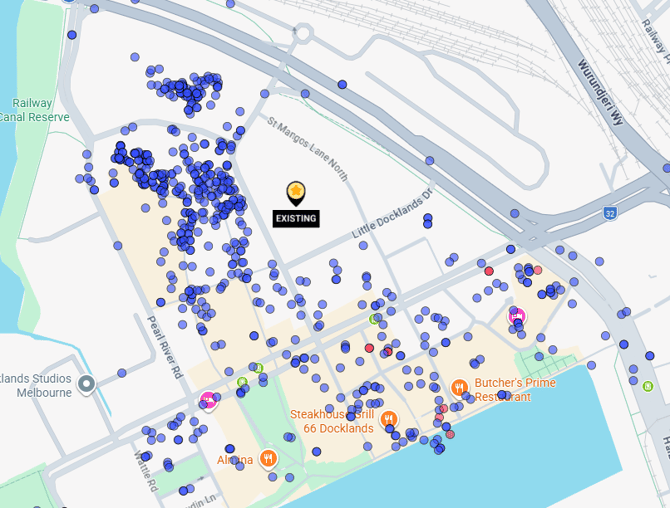
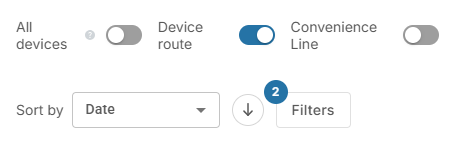
All Devices Shows the locations of all devices on the map.
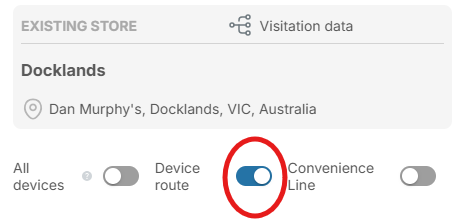
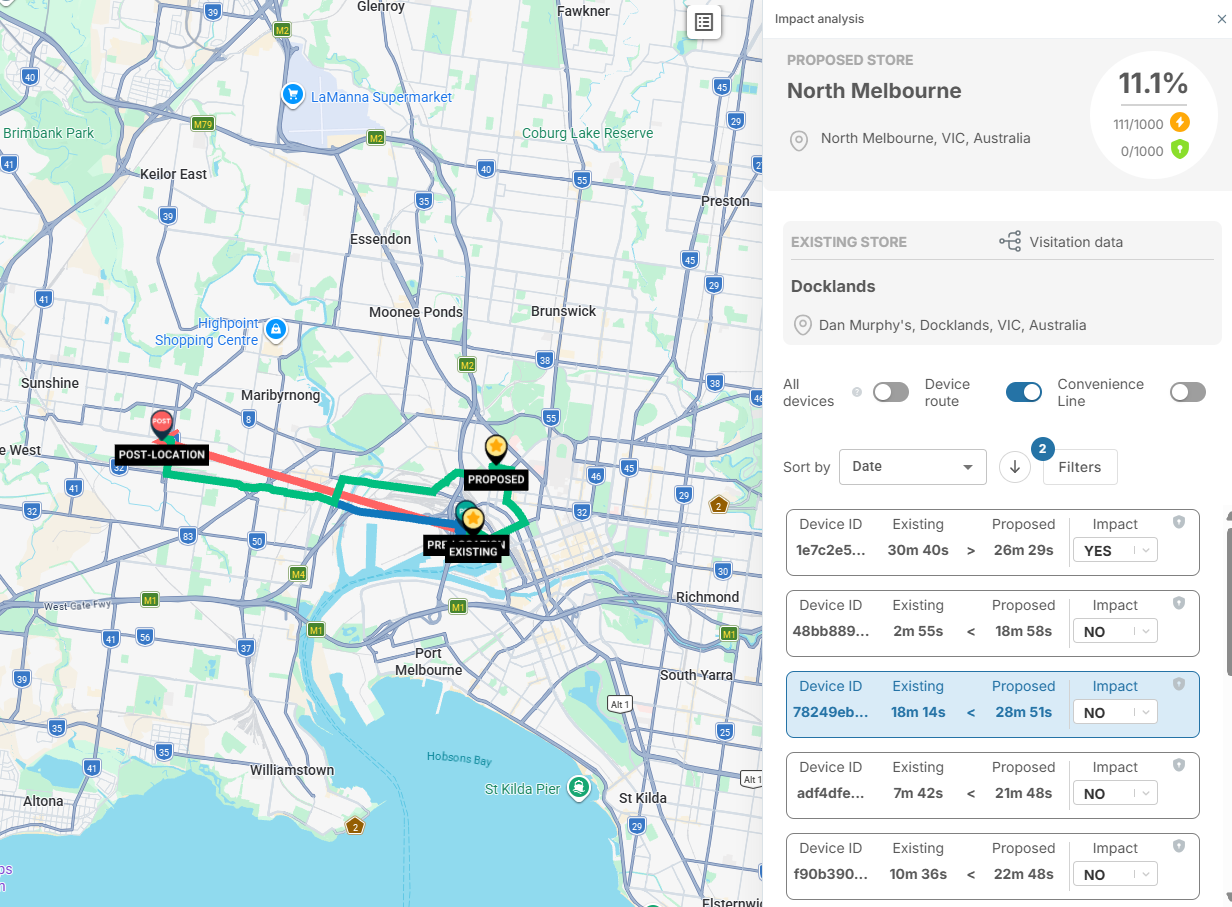
Device Route When you select a specific device record, this feature enables you to visualize the actual route the device took and compare it to the potential route it could have taken.
The convenience line marks the boundary between the two sites, and standing on this line would result in equal travel time to both sites. |
|
3 |
Sorting and Filtering |
Allows you to sort and filter the device routes by different variables.
|
|
4 |
Device Routes |
Each device route taken into consideration for the Impact Analysis report is listed here. Click each line to visualise it on the map. |
|
5 |
Download and Save |
Download Allows you to download a csv that contains information about each device in the report
Save Allows you to save changes you have made |
Visualising and Reviewing Device Routes
You may want to review individual trips to validate the numbers presented in the Impact Analysis Summary.
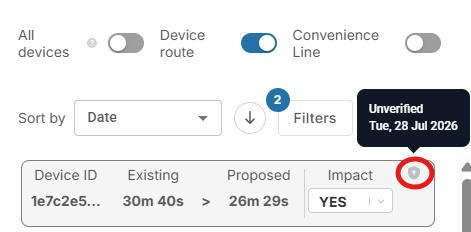
You have the option to review each trip included in the report and manually update its status based on whether it had a significant impact, had no impact, had a 50/50 split impact (convenient to go to both locations), or should be omitted from the analysis. Additionally, you can click on the 'verify' button to indicate that you have verified the record.
⚠️TIP
The Impact Analysis report typically contains 1000 records for review. Utilise the sort and filter options to concentrate on the most relevant records for your needs.
How to Visualise and Understand Device Routes
Visualising all Devices
- Toggle the 'device routes' button to on by clicking it
- The blue circles are devices/routes that are not impacted by the new site
- The red circles are devices/routes that are impacted by the new site
Analysing Individual Device Routes
⚠️ Ensure device routes is toggled on
- Select a route from the list and the route will appear on the map
- Select a route from the list and the route will appear on the map
|
EXISTING |
The location of your existing site |
|
PROPOSED |
The location of the proposed site |
|
PRE LOCATION |
Where the device was seen prior to visiting the existing site |
|
POST LOCATION |
Where the device was seen after visiting the existing site |
Reviewing Device Routes

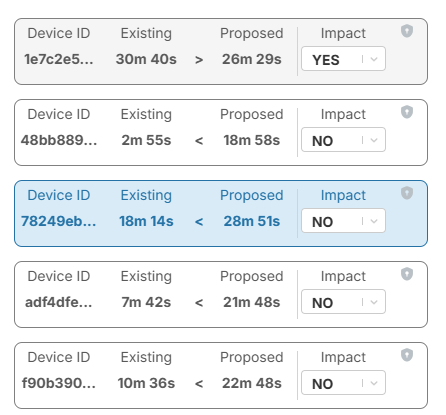
You might come across certain routes that require updates in their impacted or not impacted status. You have four options to mark these routes: "Impacted" (yes), "Not Impacted" (no), "Omit," or "Split."
The impact status can be updated by clicking on the blue word to cycle through the options. Once your changes have been made, click save at the bottom of the screen.
The updated changes will reflect in the impact summary.
|
Yes |
The route impacts the existing site |
|
No |
The route does not impact the existing site |
|
Omit |
The route is not relevant (e.g., the client may have come from interstate). |
|
Split |
The route is equally convenient for both the existing and proposed sites. |
Filtering Routes
To concentrate on the most relevant records for your needs you may wish to sort or filter the routes.
- Click the Sort or Filter option and select the relevant variables.
Filtering Options
You have the capability to filter the visitation routes using a wide range of variables. Please refer to the table provided for the definitions of these variables.
|
Record Type |
Display only routes that have a specific impact status
eg. filter for only impacted routes to be reviewed |
|
Record Status |
Display only routes that have been verified by you or your colleagues |
|
Deduplicate Device ID By |
Display either only the most recent trip for device routes that have duplicate trips, or the most time observed only. |
|
Time of Day |
Display routes that were observed at particular times of the day |
|
Duration |
Display only devices routes that have a certain travel time range |
|
Buffer |
Buffer Time is an optional filter that can be applied to impact analysis once it has been generated. It refers to the additional minutes (typically 1 to 2) added to one or both legs of a journey. This adjustment accounts for the time people spend walking from their car to the store or site for scenarios such as when parking availability is limited. |
|
Date Range |
Display only routes that were observed within a certain date range |

Things to Note
- Impact analysis will provide a maximum of 5000 individual routes per report however will always default to display the most recent 1000 visits.
- At times you may find your report generates fewer than 1000 visits. Please refer to the below matrix on what to do:
|
Amount of Results |
Impact Quality |
|
Under 200 |
Not good. Regenerate the report. |
|
201 - 300 |
Usable but not recommended |
|
301 - 500 |
Acceptable |
|
501 - 700 |
Good |
|
701+ |
Great |