
Portfolio Report (also known as Portfolio Analysis) is a bulk catchment reporting tool. It takes a set of your locations, applies the same catchments to every one of them, measures the variables you choose inside each catchment, and produces a single joined report — giving you a clear, side-by-side view of the demographic and point-of-interest data surrounding each of your sites.
If you are interested in enabling Portfolio Report on your account, please reach out to your Customer Success Manager, or start a chat with us in the bottom left corner.
For each location, the report can include:
- Up to 30 demographic variables, measured inside each selected catchment
- Counts of nominated locations within each catchment (e.g. nearby competitors)
- The closest distance from each location to nominated point types
- Site metadata (optional) and Cluster/Tier data (included by default)
Understanding catchment types
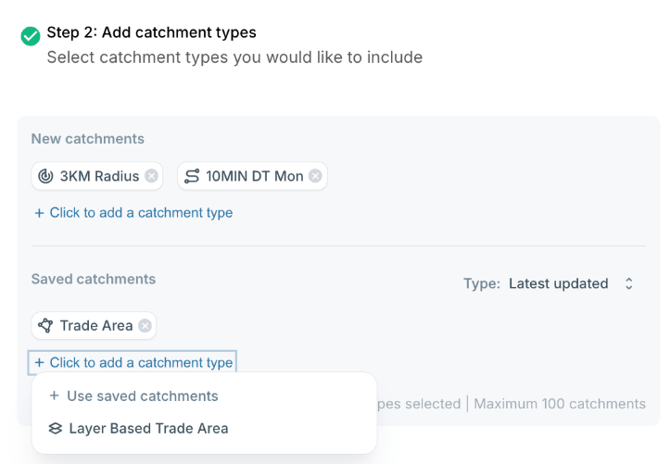
New catchments — radius and drive time catchments are generated fresh when the report runs. Each location gets exactly one of each (a 3km radius is one specific circle around that pin), so the output is always one row per location.
Saved catchments — Trade Areas, Layer Based Trade Areas, saved Drive Time areas and Custom Radius areas are stored against your locations ahead of time. A single location can have several of them (a current trade area, a renewal mapping, test versions, and so on). Because of this, when you add a saved catchment type you'll also choose a Type option that tells the report which of a location's areas to use:
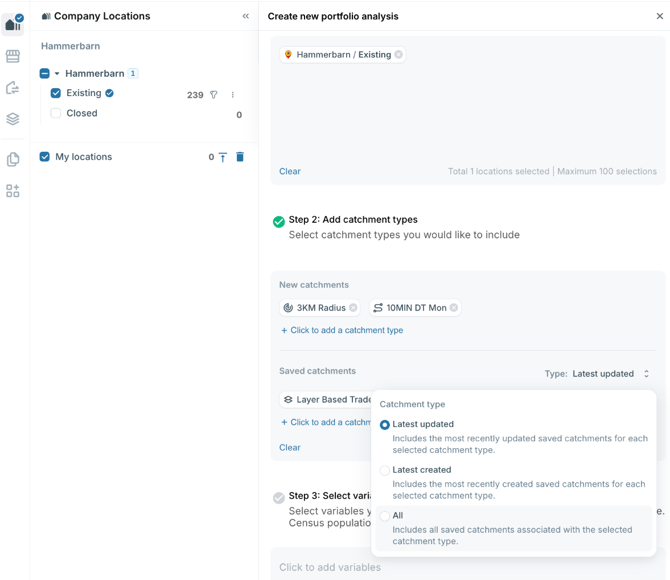
- Latest updated — for each location, the most recently updated saved area of each selected type. The usual default when you want the current, actively maintained version of each area, keeping one row per location.
- Latest created — for each location, the most recently created saved area of each selected type. Use this when the newest area drawn is the one that matters, regardless of later edits to older ones.
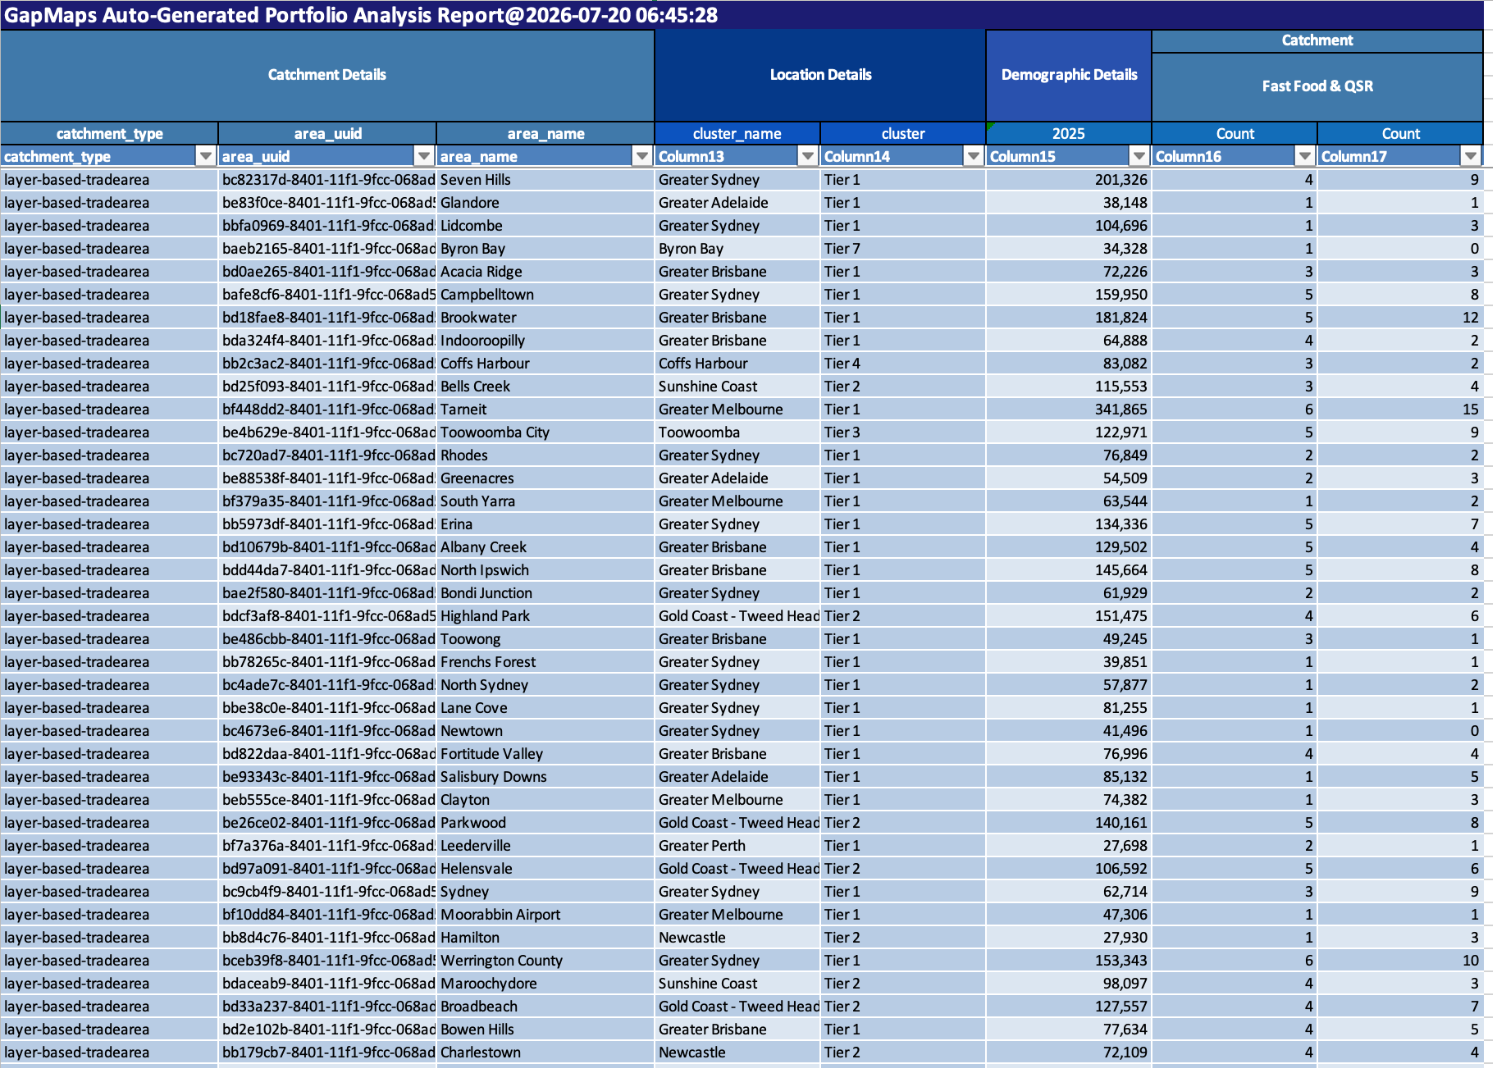
- All — every saved area of the selected types, for every location. Use this when you need to see, compare or tidy up all the areas a location has, such as shopping centre reporting or auditing trade areas across your portfolio. Because a location can have multiple areas, this output is delivered on a separate tab in the export (see "Understanding your export" below).
Running a Portfolio Report
Step 1 — Select location types
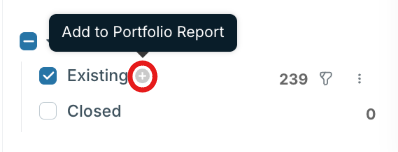
- Hover over any Company Location Type (such as Existing or Proposed), click the '+' and then click 'Add to Portfolio Report'. This opens the 'Create new portfolio analysis' panel.
- Repeat for any other Company Location Types you want in the report.
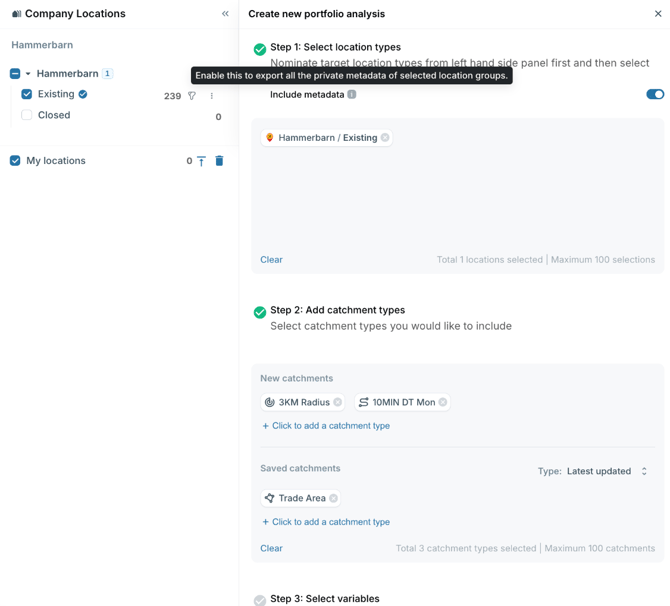
- To add pin-level attributes (site name, code, status, address, opening date and custom fields) to the export, switch on 'Include metadata'. Only private metadata is included — public locations are aggregated as counts.
Step 2 — Add catchment types
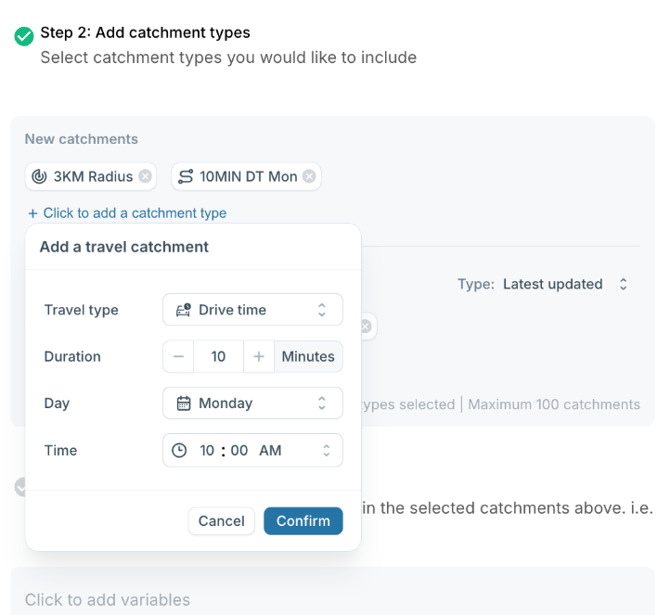
- Under 'New catchments', click 'Click to add a catchment type' to add radius catchments (in metres, kilometres or miles) or a travel catchment. For a travel catchment, choose the travel type (e.g. drive time), duration, day and time — for example, a 10 minute drive time on a Monday at 10:00 AM.
-
Under 'Saved catchments', click 'Click to add a catchment type' to add your saved catchments or Layer Based Trade Areas, and set the Type selector (Latest updated, Latest created or All) as described above.
Step 3 — Select variables
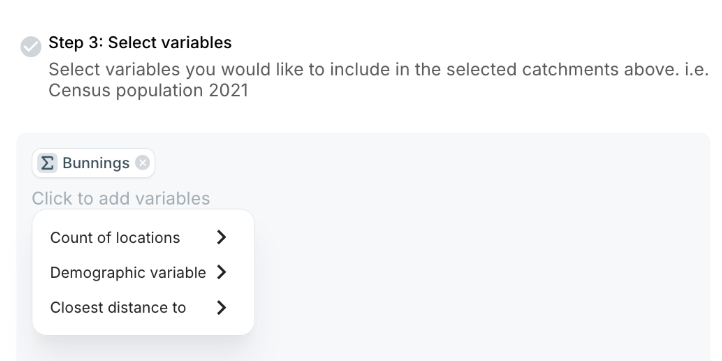
Click 'Click to add variables' and choose from three kinds of variable:
-
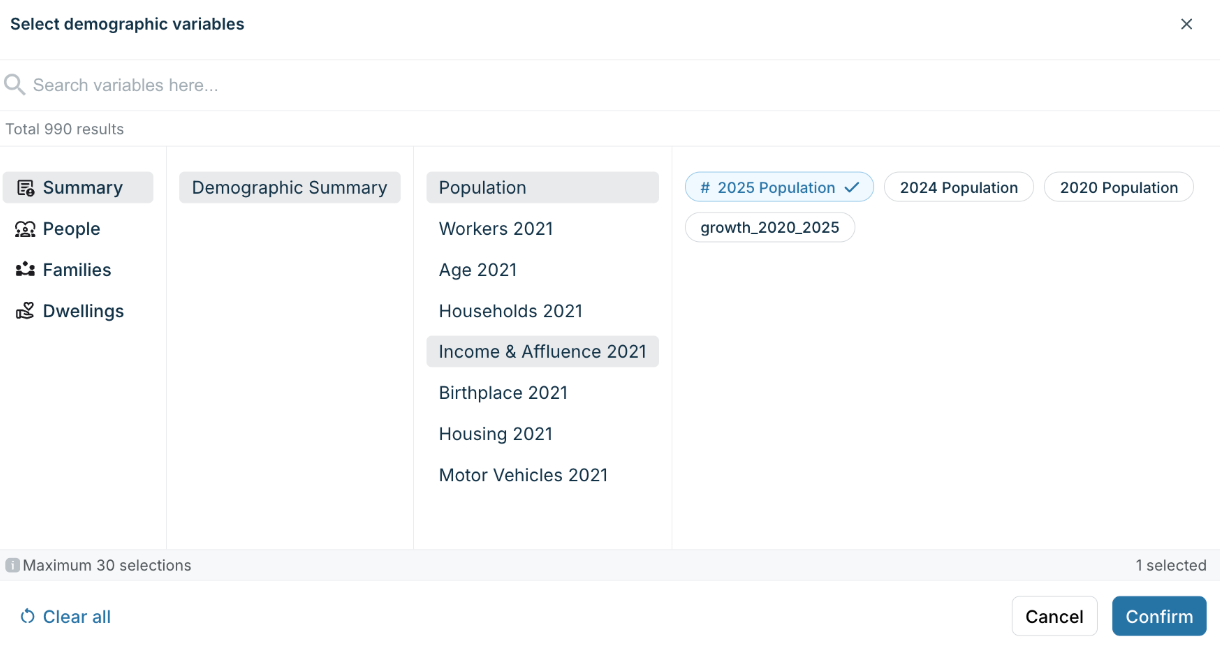
- Demographic variable — census and modelled measures (population, age, income & affluence, households, dwellings and more), searchable and grouped by category. Up to 30 selections.
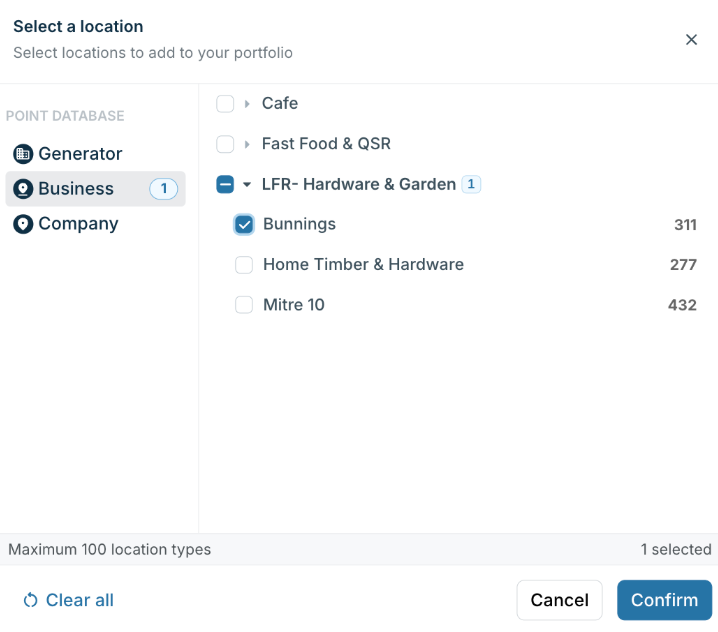
- Count of locations — how many of the nominated locations (from the Generator, Business or Company point databases) fall within each catchment.
- Closest distance to — the closest distance from each of your locations to any nominated listing.
Generate your report
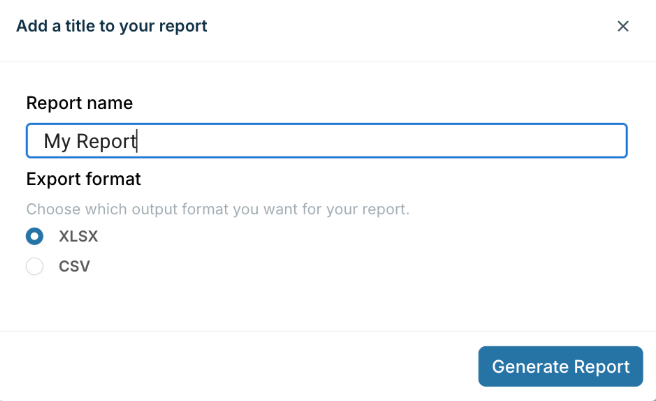
- Click 'Generate Report', give your report a name, and choose your export format — XLSX for a formatted workbook, or CSV for a flat file with flattened headers (useful for feeding the output into models or other tools).
- You will receive an email once your report has finished generating (up to 15 minutes). To view it, go to the 'Report' module, where you can see its status and, once complete, click 'download as excel' to download it.
Understanding your export
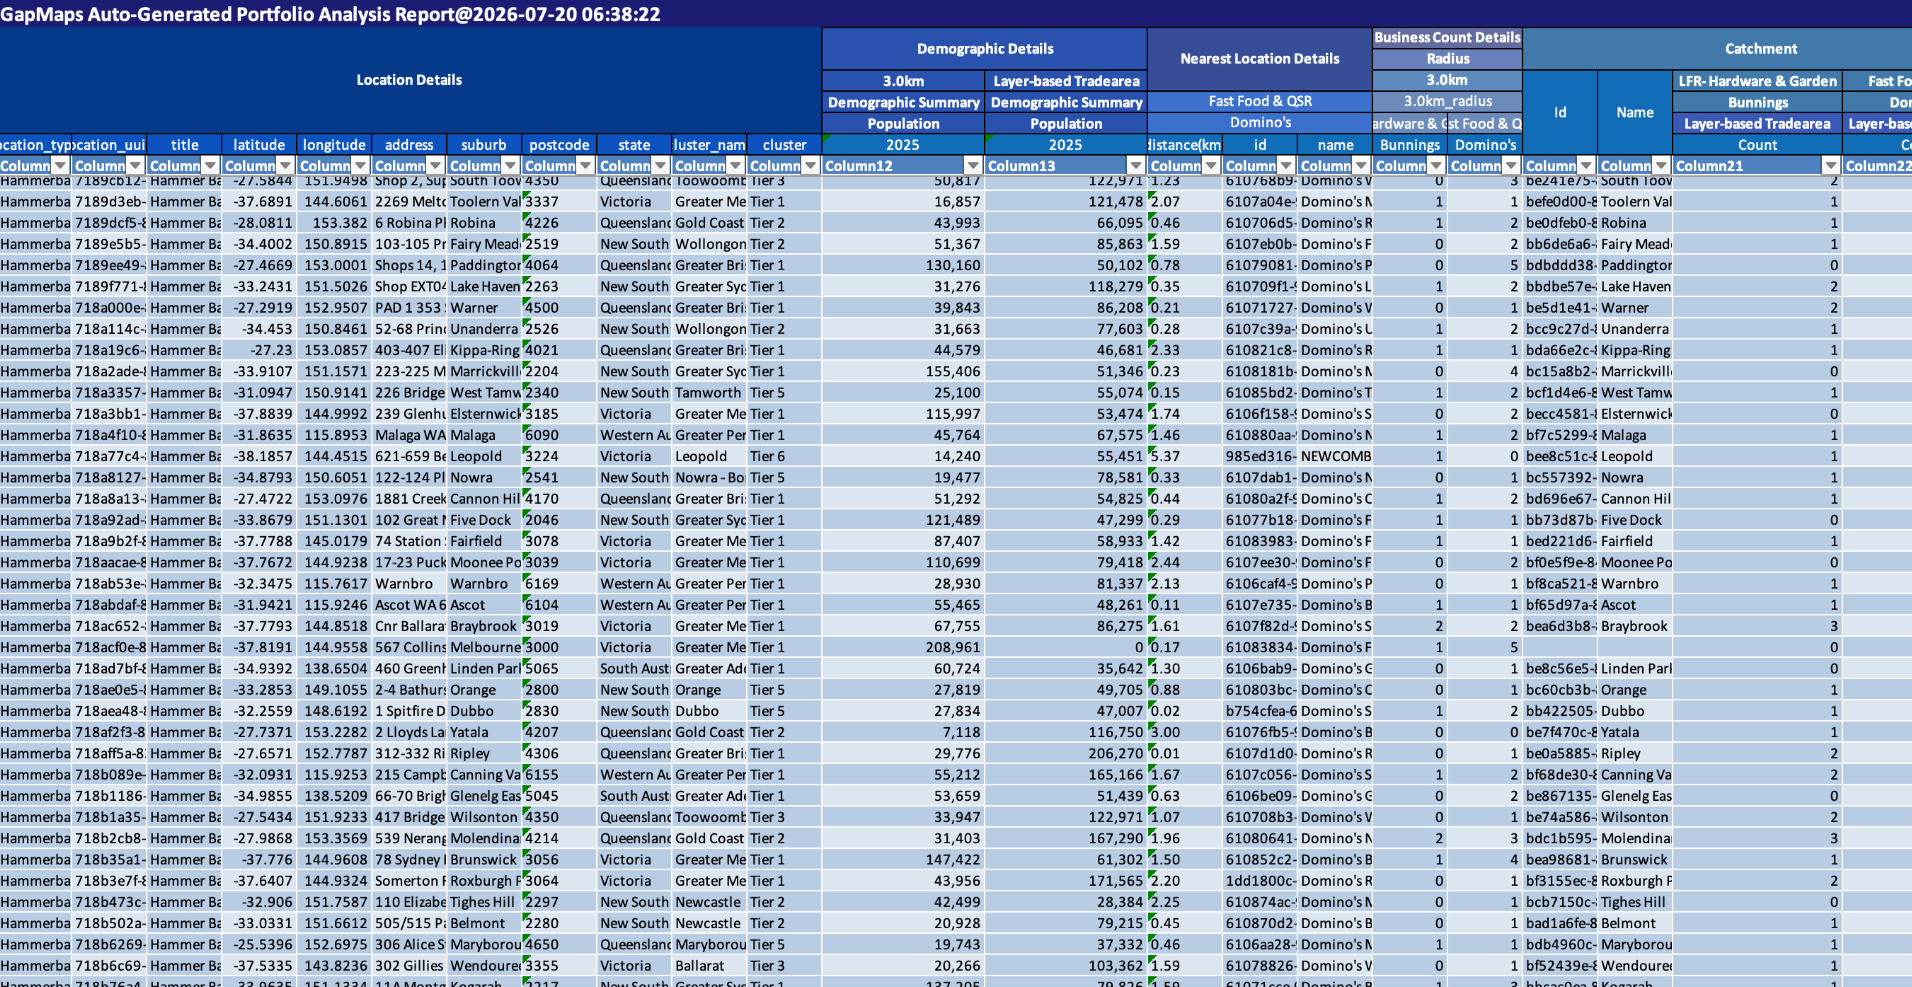
The main report has one row per location, with each catchment × variable combination as a column — for example, "2025 Population within 3km" and "2025 Population within the trade area" sit side by side for the same location.
A few things to know about the output:
- Cluster and Tier columns are included by default.
- Metadata columns appear if you enabled Include Site Metadata in Step 1.
- The "All" saved-areas tab — if you chose Type: All for a saved catchment, that data is delivered on a separate tab with one row per area, so the main report stays one row per location. Each area row repeats the location details and includes the area's name, date created and date updated, so you can see the provenance of each area. Locations with no saved area of the selected type are still listed, so missing data is visible rather than silently dropped.
- Split tabs for mixed catchments — if you combine radius and saved-area catchments, results are split across tabs with an executive summary.
- POI grouping — point-of-interest results are grouped by business listing category.
- Distance-to — distances are measured from each base location to the closest nominated listing. A location's own pin is excluded, so you won't see 0km self-matches for your own company locations.
Limits
- Up to 2,000 Drive Times can be included per report
- Complex reports with many variables and areas used can affect execution of the report and you will be notified before running if the report is too complex.
User Access & Permissions
Who can run a report:
Any user on an account with access to Portfolio Report can run a report for any available location type.
Who can view the report:
Once a report is created, it is saved against the account (under the Reports module) and is accessible to all users within that account, regardless of who generated it.
FAQ
Which trade area does "Latest updated" pick if a location has several?
The single most recently updated area of each selected saved catchment type. If you want to compare all of a location's areas, choose Type: All — the export includes each area's created and updated dates so you can verify which one "latest" resolved to.
Why does one of my locations appear on multiple rows?
You've selected Type: All for a saved catchment. Locations with more than one saved area of that type get one row per area on the detail tab; the main report tab remains one row per location.
Can I re-run a report with different settings?
Reports capture the settings chosen at the time they were generated. To change catchments or variables, create a new Portfolio Report.