
Table View presents networks in a clear, structured table format, making it easier to compare how brands are distributed across cities, review market coverage, and benchmark competitors.
If you're interested in having Table View enabled on your account, please reach out to us via chat, your Customer Success Manager or email clientservices@gapmaps.com
What is Table View?
Table View brings a new type of data visualisation to GapMaps Live. Alowing you to pivot between seeing your network via map view and in a table.
Using Table View
Switch to Table View using the toggle at the bottom of the screen.
You can always hide the toggle bar by clicking the eye icon. Bring the toggle bar back by clicking the arrow at the bottom of the screen.
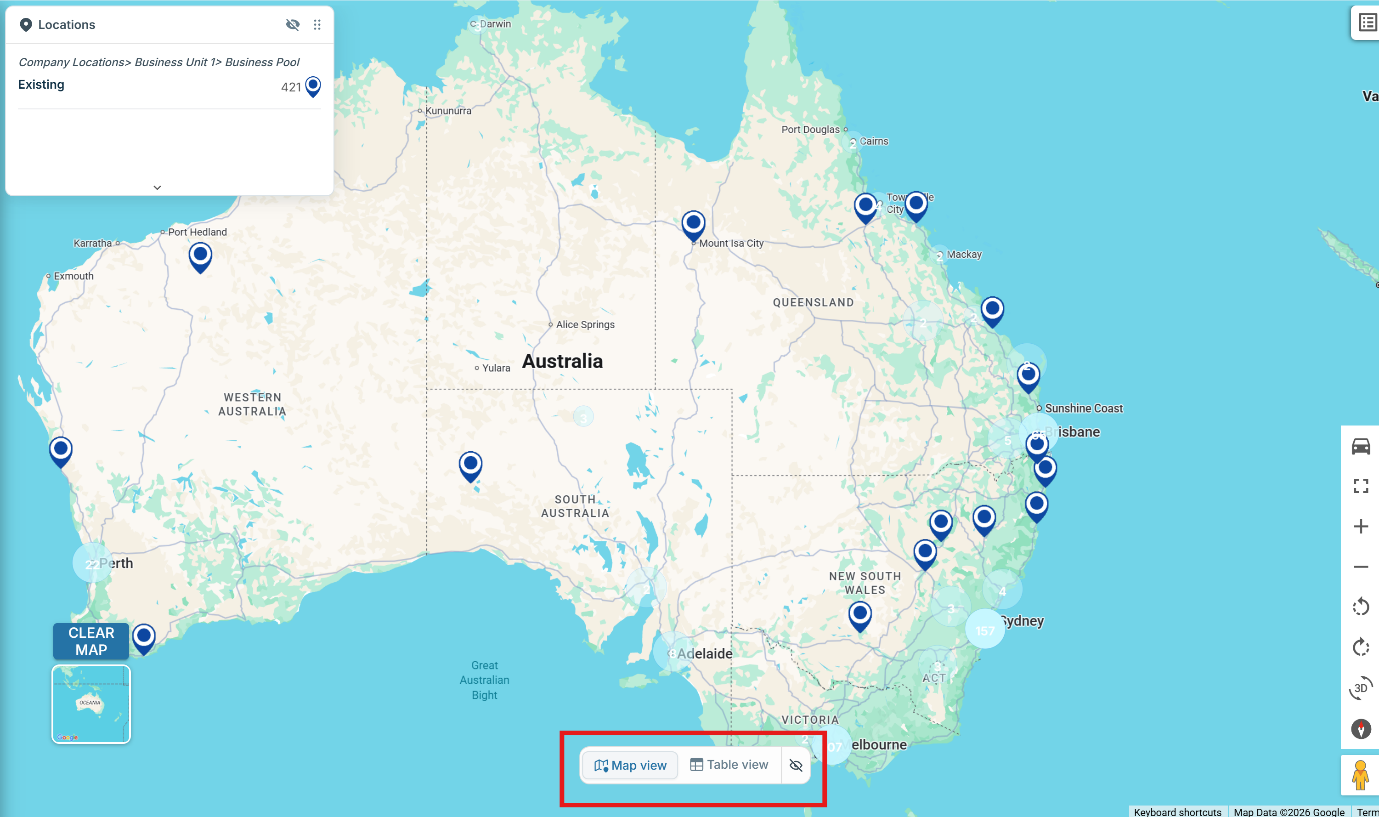
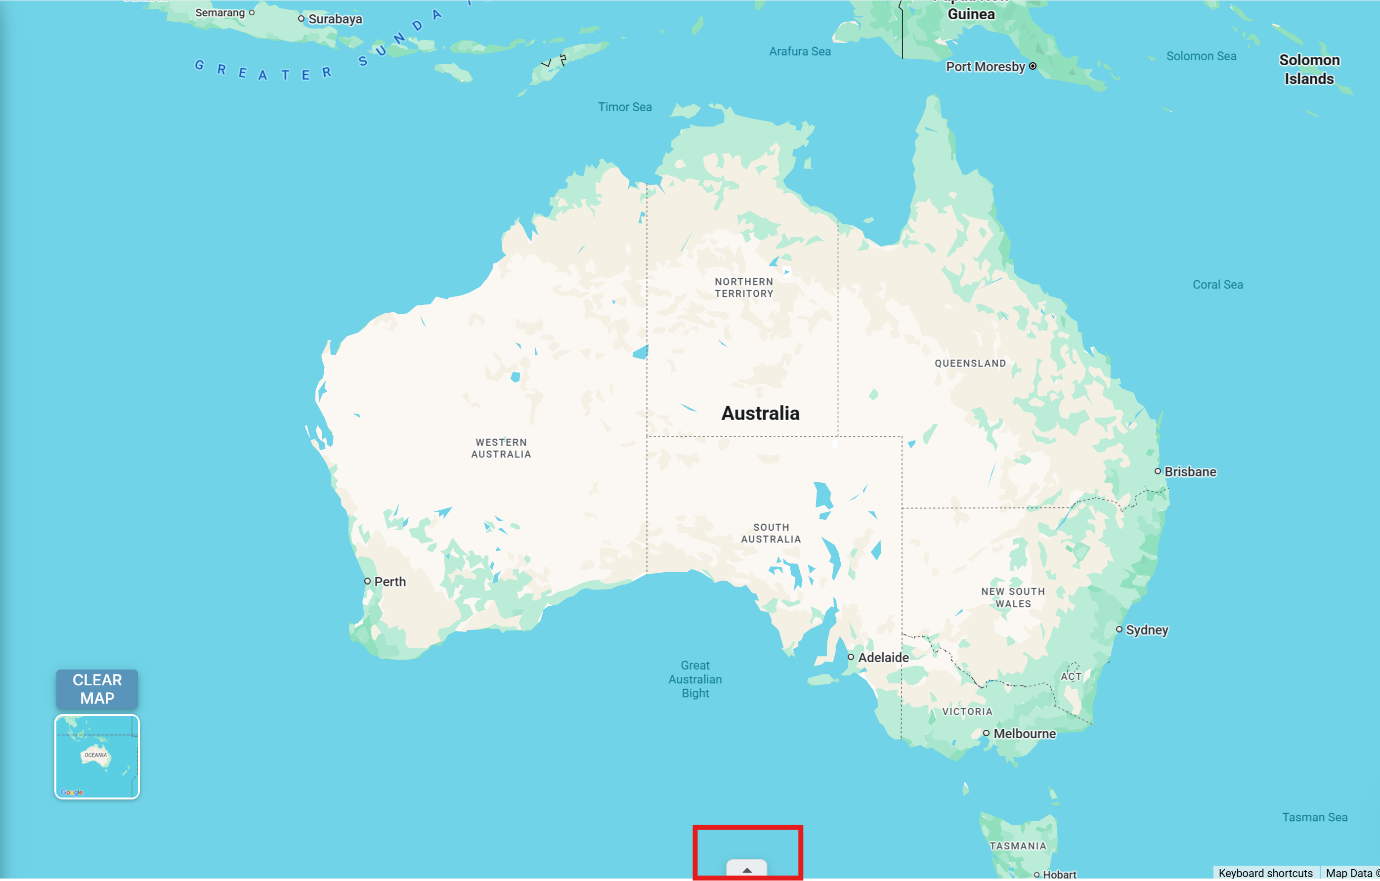
Table View will be populated with any Company Locations, Business Locations and Generators that you have selected in the left side panel.

Adjust which points of interest are visible in Table View by selecting them from the left hand panel. This is the same process as visualising locations in Map View.
Table View Functions
Table View Variable Tabs
Switching between States and Clusters
Click 'Switch to cluster cities' to toggle Table View between States and Clusters.
This interface also provides insight into total states and clusters, along with a table summarising tiers, total cities and details.
Chart View
- Click open chart view
- Toggle between total tier count and total tier percentage
- Select either horizontal or vertical view
- Open in new window for a floating window containing the chart that may be moved and resized
- Hover over a section of the chart to view the legend
Navigation Tips
- You can click on the columns to expand and collapse all
FAQs
- You can view the clusters via admin boundary layer > clusters